
Note
Go to the end to download the full example code.
The LoRa modulation: error rates, spectrum and interference#
Chirp spread spectrum, the modulation of LoRa (comnum.Css), in four panels, each to
open next to the figure of the paper it reproduces. The SNR is that of a sample at one
sample per chip, the abscissa of the papers.
Error rate over AWGN. O. Afisiadis, M. Cotting, A. Burg and A. Balatsoukas-Stimming, “On the error rate of the LoRa modulation with interference”, IEEE Trans. Wireless Commun. 19(2), 2020, Fig. 2: the exact SER of their eq. (16) (
theory_css_ser), its approximation (17), and simulated points.FSCM against FSK. L. Vangelista, “Frequency shift chirp modulation: the LoRa modulation”, IEEE Signal Process. Lett. 24(12), 2017, Fig. 1: SF 7 over AWGN, where both are orthogonal signalling, and over the channel \(\sqrt{0.8}\,\delta[n] + \sqrt{0.2}\,\delta[n-1]\), where the chirp spreads the loss over the band.
Spectrum. M. Chiani and A. Elzanaty, “On the LoRa modulation for IoT: waveform properties and spectral analysis”, IEEE Internet Things J. 6(5), 2019, Fig. 3a: the continuous spectrum of the complex envelope (eq. (20), Fresnel functions); lines hold exactly \(1/M\) of the power.
Interference. Afisiadis et al. 2020, Fig. 7: a same-SF interferer 3 dB below the signal, neither chip- nor phase-aligned; the approximation (63) with the strongest bin at \([-\lfloor\tau\rceil]_M\) (their eq. (58) prints \(\lfloor\tau\rceil\)) against a simulation.
LoRa is a trademark of Semtech; this models the published descriptions for research.
validation/tests/modulation/css.rs checks the same comparisons with tolerances.
import matplotlib.pyplot as plt
import numpy as np

import comnum
from comnum.plot import MUTED


def ser_sim(css, snr_db, n, seed, taps=(1.0,)):
    rng = comnum.Rng(seed)
    sym = rng.integers(css.m, n)
    x = css.modulate(sym)
    y = np.convolve(x, np.asarray(taps))[: x.size]
    y = y + rng.complex_noise(y.size, 1 / comnum.db2lin(snr_db))
    return float(np.mean(css.demodulate(y) != sym))


fig, axes = plt.subplots(2, 2, figsize=(11, 8.2))

# 1. SER over AWGN, SF 7 to 12
ax = axes[0, 0]
for sf in range(7, 13):
    snr = np.linspace(-26, -5, 85)
    (line,) = ax.semilogy(snr, comnum.theory_css_ser(sf, snr), linewidth=1.4, label=f"SF {sf}")
    ax.semilogy(
        snr,
        comnum.theory_css_ser(sf, snr, approximation="rice"),
        ":",
        color=line.get_color(),
        linewidth=1.0,
    )
    points = np.arange(-26, -5)
    points = points[
        (comnum.theory_css_ser(sf, points * 1.0) > 3e-3)
        & (comnum.theory_css_ser(sf, points * 1.0) < 0.5)
    ]
    sim = [ser_sim(comnum.Css(sf), p, 3000 if sf < 11 else 1000, sf) for p in points]
    ax.semilogy(points, sim, "o", color=line.get_color(), markersize=4)
ax.set(
    ylim=(1e-5, 1),
    xlabel="SNR per sample (dB)",
    ylabel="SER",
    title="AWGN: exact (16), approximation (17), simulation",
)
ax.legend(loc="lower left", ncol=2, fontsize=8)

# 2. FSCM and FSK, flat and frequency-selective
ax = axes[0, 1]
snr = np.arange(-12, 0, 1.0)
flat = comnum.theory_css_ber(7, snr)
ax.semilogy(snr, flat, color=MUTED, label="flat (FSCM = FSK)")
taps = (np.sqrt(0.8), np.sqrt(0.2))
for waveform, marker in [("vangelista", "s"), ("fsk", "^")]:
    css = comnum.Css(7, waveform=waveform)
    ber = [ser_sim(css, s, 8000, 7, taps) * 128 / 254 for s in snr]
    ax.semilogy(snr, np.maximum(ber, 1e-6), marker + "-", label=f"selective, {waveform}")
ax.set(
    ylim=(1e-5, 0.5),
    xlabel="SNR per sample (dB)",
    ylabel="BER",
    title="SF 7 (Vangelista 2017, Fig. 1)",
)
ax.legend(loc="lower left")

# 3. the continuous spectrum
ax = axes[1, 0]
f = np.linspace(0, 1, 401)
for sf in (3, 5, 7):
    g = comnum.css_continuous_spectrum(sf, f)
    ax.plot(f, comnum.lin2db(np.maximum(g, 1e-12)), label=f"SF {sf}")
ax.set(
    ylim=(-50, 5),
    xlabel="$f/B$",
    ylabel="$10 \\log_{10} G^c(f) B$",
    title="Continuous spectrum (Chiani & Elzanaty 2019, Fig. 3a)",
)
ax.legend()

# 4. same-SF interference, SF 9, P_I = -3 dB
ax = axes[1, 1]
snr = np.arange(-18, -8, 1.0)
ax.semilogy(snr, comnum.theory_css_ser(9, snr), color=MUTED, linewidth=1.0, label="AWGN only")
approx = [comnum.theory_css_ser_interference(9, s, -3.0) for s in snr]
ax.semilogy(snr, approx, label="approximation (63)")
css = comnum.Css(9)
rng = comnum.Rng(9)
sim = []
for s in snr[:7:2]:
    n, errors = 4000, 0
    for _ in range(n):
        a, s1, s2 = (int(v) for v in rng.integers(512, 3))
        tau = float(rng.uniform(1)[0] * 512)
        phase = np.exp(2j * np.pi * rng.uniform(2))
        y = phase[0] * css.symbol(a) + phase[1] * 10 ** (-3 / 20) * css.interferer(s1, s2, tau)
        y = y + rng.complex_noise(512, 1 / comnum.db2lin(s))
        errors += int(css.demodulate(y)[0] != a)
    sim.append(errors / n)
ax.semilogy(snr[:7:2], np.maximum(sim, 1e-5), "o", label="simulation")
ax.set(
    ylim=(1e-5, 1),
    xlabel="SNR per sample (dB)",
    ylabel="SER",
    title="SF 9, interferer at -3 dB (Afisiadis et al. 2020, Fig. 7)",
)
ax.legend(loc="lower left")
fig.tight_layout()
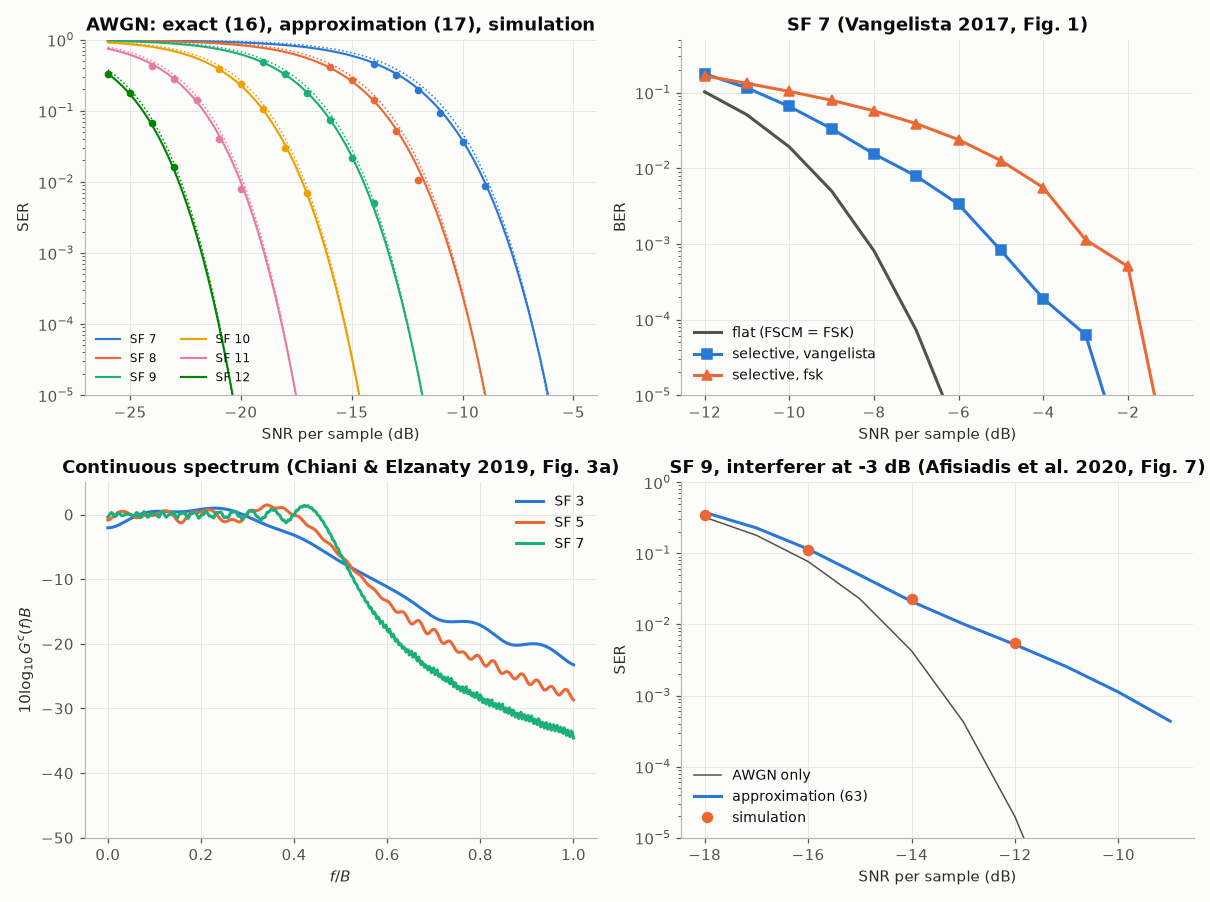
The exact SER of eq. (16) follows the simulation over the whole range and eq. (17) within 30 %. Over the frequency-selective channel the chirp loses about 1 dB where FSK loses about 4 dB; the simulated FSCM is about 0.5 dB above the curve of Vangelista’s figure, whose AWGN curve the theory reproduces exactly.
print(
    f"SF 7 at -8 dB: SER {comnum.theory_css_ser(7, -8.0):.2e} (Fig. 2 of Afisiadis et al.: 1.8e-3)"
)
SF 7 at -8 dB: SER 1.61e-03 (Fig. 2 of Afisiadis et al.: 1.8e-3)
Total running time of the script: (0 minutes 8.562 seconds)