
Note
Go to the end to download the full example code.
Thompson et al. 2008, Fig. 2: the CE-OFDM phase demodulator#
Fig. 2 of S. C. Thompson, A. U. Ahmed, J. G. Proakis, J. R. Zeidler and M. J. Geile, “Constant envelope OFDM”, IEEE Trans. Commun. 56(8), 2008, shows the BER of the phase demodulator receiver of constant-envelope OFDM for 8-PAM data symbols and \(N = 126\) subcarriers, at modulation indices \(2\pi h\) from 0.1 to 1.5, against the approximation of eq. (15) of the paper, valid above the threshold of the phase demodulator:
The blocks ce_ofdm_tx and ce_ofdm_rx modulate the symbols of a 64-QAM source,
whose real and imaginary parts are two 8-PAM symbols, so the energy per bit is
\(E_s/N_0 - 10\log_{10} 6\) with \(E_s/N_0\) the SNR per QAM symbol of the
awgn block. The receiver unwraps the phase along the stream, as the phase
unwrapper of the paper’s receiver (its Fig. 1), with an oversampling \(J = 4\)
(a DFT of \(2J(N + 1) = 1016\) points; the paper’s 512-point DFT with its
oversampling factor of 4 corresponds to \(J = 2\), at which the library’s
unwrapper fails above \(2\pi h = 0.7\)). The unit test literature of
comnum_waveform::ce_ofdm checks eq. (15) itself; this campaign shows the threshold
below which the approximation fails, as in the figure: open Fig. 2 of the paper next
to it.
import math

import matplotlib.pyplot as plt
import numpy as np

import comnum
from comnum.plot import BACKGROUND, MUTED

TWO_PI_H = [0.3, 0.5, 0.7, 1.0]
EBN0 = np.arange(0.0, 36.0, 5.0)
M = 8
results = comnum.run_spec(
    {
        "name": "thompson2008_fig2",
        "seed": 1,
        "grid": {
            "h": [round(x / (2 * math.pi), 6) for x in TWO_PI_H],
            "esn0_db": [round(e + comnum.lin2db(6), 4) for e in EBN0],
        },
        "link": [
            {"type": "source", "constellation": "64-QAM", "n_symbols": 126 * 32},
            {"type": "ce_ofdm_tx", "n_subcarriers": 126, "oversampling": 4, "h": "$h"},
            {"type": "awgn", "snr_db": "$esn0_db"},
            {
                "type": "ce_ofdm_rx",
                "n_subcarriers": 126,
                "oversampling": 4,
                "h": "$h",
                "unwrap": "stream",
            },
        ],
        "metrics": {"report": ["ber"], "scale": "none"},
        "stop": {"min_errors": {"ber": 300}, "min_trials": 2, "max_trials": 200},
    }
)


def eq15(ebn0_db, two_pi_h):
    k = math.log2(M)
    e = comnum.db2lin(ebn0_db)
    return 2 * (M - 1) / (M * k) * comnum.qfunc(two_pi_h * np.sqrt(6 * k / (M * M - 1) * e))


fig, ax = plt.subplots(figsize=(7.5, 5.2))
fine = np.linspace(0, 35, 141)
for i, two_pi_h in enumerate(TWO_PI_H):
    h = round(two_pi_h / (2 * math.pi), 6)
    _, ber = results.series("esn0_db", "ber", min_count=20, h=h)  # NaN: fewer than 20 errors
    (line,) = ax.semilogy(fine, eq15(fine, two_pi_h), linewidth=1.4)
    ax.semilogy(EBN0, ber, "osD^"[i], color=line.get_color(), markeredgecolor=BACKGROUND,
                label=f"$2\\pi h$ = {two_pi_h}")  # fmt: skip
ax.plot([], [], color=MUTED, linewidth=1.4, label="eq. (15)")
ax.set(
    xlim=(0, 35),
    ylim=(1e-4, 0.5),
    xlabel="$E_b/N_0$ (dB)",
    ylabel="bit error rate",
    title="CE-OFDM, 8-PAM, N = 126 (Thompson et al. 2008, Fig. 2)",
)
ax.legend(loc="lower left")
fig.tight_layout()
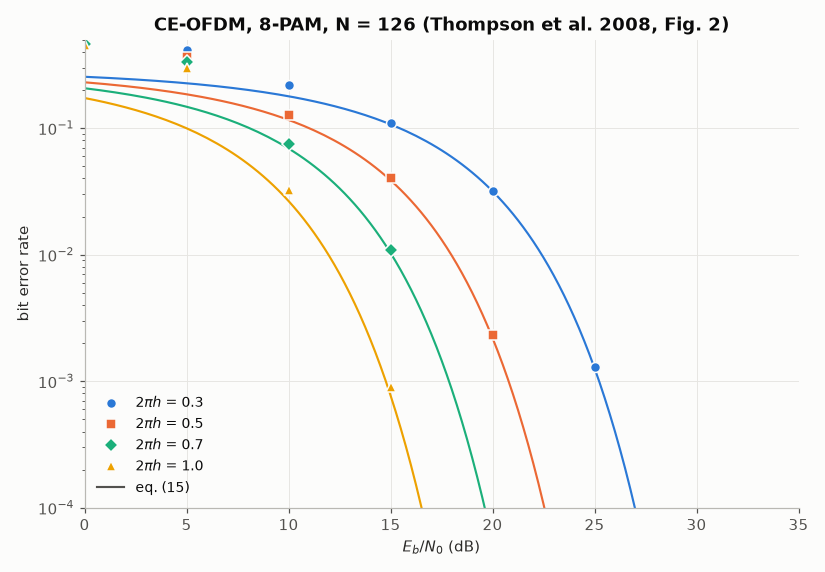
Above the threshold of the phase demodulator (a carrier-to-noise ratio of about 10 dB, Sec. III-B of the paper), the simulated points follow eq. (15): a larger modulation index buys SNR at the price of bandwidth. Below it, the phase demodulator fails and the BER stays above the approximation, which is the shape of the paper’s curves at low \(E_b/N_0\).
2πh = 0.3: BER 1.29e-03 at 25 dB, eq. (15) 1.27e-03
2πh = 0.5: BER 6.20e-07 at 25 dB, eq. (15) 5.86e-07
2πh = 0.7: BER 0.00e+00 at 25 dB, eq. (15) 8.34e-12
2πh = 1.0: BER 0.00e+00 at 25 dB, eq. (15) 5.82e-22
Total running time of the script: (0 minutes 3.233 seconds)