
Note
Go to the end to download the full example code.
DVB-S: the error rate after the Viterbi decoder against Table 3#
comnum.Dvbs implements the DVB-S transmitter of ETSI EN 300 421 V1.1.2 and a
receiver aligned on the burst: the energy dispersal of the MPEG-2 transport stream (the
PRBS \(1 + X^{14} + X^{15}\) reset every 8 packets), the outer code RS(204, 188), the
convolutional interleaver of 12 branches (depths \(17 j\)), the inner code of
constraint length 7 (\(X\) from \(171_8\), \(Y\) from \(133_8\)) punctured
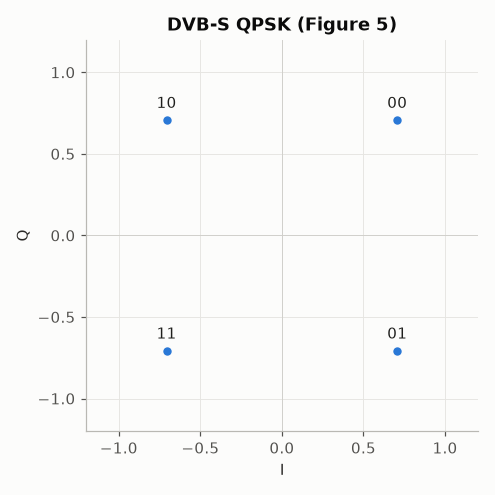
to 2/3, 3/4, 5/6 or 7/8 by Table 2, and the Gray QPSK of Figure 5.
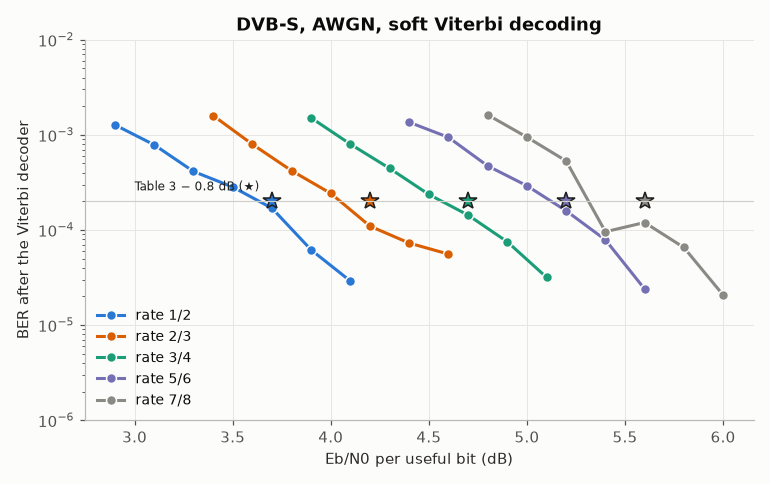
Table 3 gives the \(E_b/N_0\) per useful bit (before the outer code) at which the
BER after the Viterbi decoder is \(2 \cdot 10^{-4}\), the input of the outer decoder
for a quasi-error-free output: 4.5, 5.0, 5.5, 6.0 and 6.4 dB from 1/2 to 7/8, a modem
implementation margin of 0.8 dB included. An ideal modem should reach the BER at Table 3
minus 0.8 dB. The card dvbs_table3 measures it with \(10^6\) bits per point at
3.60, 4.04, 4.50, 5.00 and 5.38 dB, 0.10 to 0.22 dB below. This script draws the
waterfalls with fewer bits.
The bits on I and Q. The punctured bits leave in time order, \(X\) before \(Y\) at every step, and alternate between I and Q: at rate 3/4, I carries \(X_1 Y_2\) and Q carries \(Y_1 X_3\), the rows of Table 2.
The BER after the Viterbi decoder: twelve bursts of 100 packets per point through the whole chain, the errors counted on the bytes entering the inner coder.
rng, noise = comnum.Rng(421), np.random.default_rng(421)
table3 = {"1/2": 4.5, "2/3": 5.0, "3/4": 5.5, "5/6": 6.0, "7/8": 6.4}
colors = [BLUE, RUST, TEAL, PURPLE, GREY]
fig, ax = plt.subplots()
for (rate, required), color in zip(table3.items(), colors, strict=True):
    link = comnum.Dvbs(rate)
    ebn0 = np.arange(required - 1.6, required - 0.39, 0.2)
    ber = []
    for e in ebn0:
        noise_var = 1 / comnum.db2lin(link.esn0_db(e))
        errors = bits = 0
        for _ in range(12):  # about 2.2e6 bits per point
            tx = link.outer(comnum.dvb_packets(100, rng))
            x = link.inner(tx)
            w = (noise.normal(size=len(x)) + 1j * noise.normal(size=len(x))) * np.sqrt(
                noise_var / 2
            )
            rx = link.inner_decode(x + w, noise_var)
            errors += int(np.unpackbits(tx ^ rx).sum())
            bits += 8 * len(tx)
        ber.append(errors / bits if errors else np.nan)
    ax.semilogy(
        ebn0, ber, marker="o", color=color, markeredgecolor=BACKGROUND, label=f"rate {rate}"
    )
    ax.plot(required - 0.8, 2e-4, marker="*", markersize=12, color=color, markeredgecolor=INK)
ax.axhline(2e-4, color=RULE, linewidth=0.8)
ax.annotate("Table 3 − 0.8 dB (★)", (3.0, 2.6e-4), color=INK, fontsize=8)
ax.set(xlabel="Eb/N0 per useful bit (dB)", ylabel="BER after the Viterbi decoder", ylim=(1e-6, 1e-2),
       title="DVB-S, AWGN, soft Viterbi decoding")  # fmt: skip
ax.legend(loc="lower left")
fig.tight_layout()
The Gray QPSK of Figure 5, label \(b_I b_Q\).
c = comnum.Dvbs("1/2").constellation
p = np.asarray(c.points)
fig, ax = plt.subplots(figsize=(4.5, 4.5))
ax.plot(p.real, p.imag, "o", color=BLUE, markeredgecolor=BACKGROUND)
for label, z in enumerate(p):
    ax.annotate(format(label, "02b"), (z.real, z.imag), textcoords="offset points", xytext=(0, 8),
                ha="center", color=INK)  # fmt: skip
ax.axhline(0, color=RULE, linewidth=0.6)
ax.axvline(0, color=RULE, linewidth=0.6)
ax.set(aspect="equal", xlim=(-1.2, 1.2), ylim=(-1.2, 1.2), xlabel="I", ylabel="Q",
       title="DVB-S QPSK (Figure 5)")  # fmt: skip
fig.tight_layout()
Total running time of the script: (0 minutes 42.650 seconds)