
Note
Go to the end to download the full example code.
DVB-T: the frame and the error rate after the Viterbi decoder against Annex A#
comnum.Dvbt implements the non-hierarchical DVB-T transmitter of ETSI EN 300 744
V1.6.2 and a receiver that knows the channel: the outer coding of DVB-S (energy dispersal,
RS(204, 188), the convolutional interleaver), the inner code (171, 133) punctured by Table 2,
the inner interleaver (six bit interleavers of 126 bits and the symbol interleaver of the
2K or 8K mode), the constellations of Figure 9, and the OFDM frame of 68 symbols with its
pilots and its transmission parameter signalling (TPS).
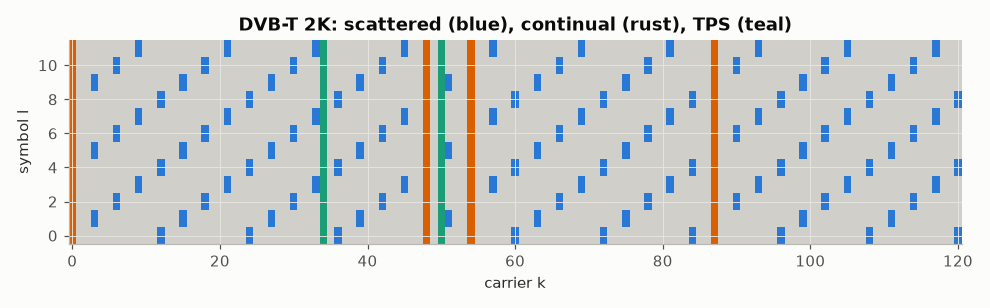
The frame. The scattered pilots move by three carriers from one symbol to the next (\(k = 3 (l \bmod 4) + 12 p\)), the continual pilots of Table 7 and the TPS carriers of Table 8 keep their places; the 1512 (2K) or 6048 (8K) remaining carriers of every symbol carry the data. The interleaving example of Annex C (Table C.1) is reproduced bit for bit.
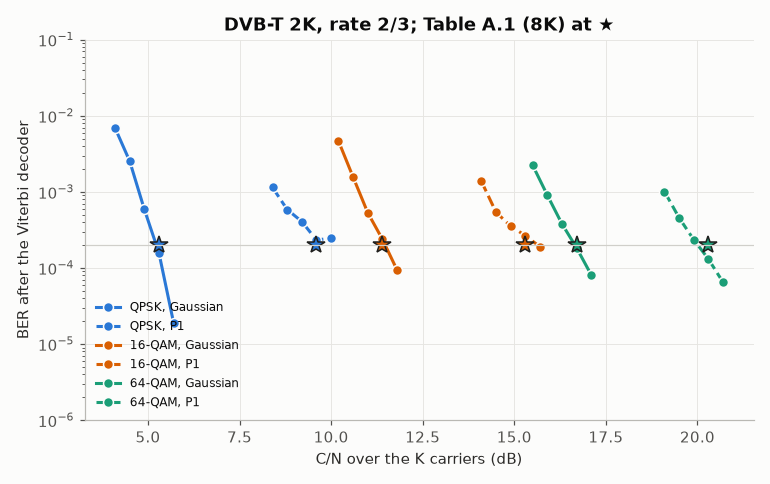
Annex A gives the C/N of a BER of \(2 \cdot 10^{-4}\) after the Viterbi decoder
in the 8K mode with perfect channel estimation, over the Gaussian channel and the fixed
(F1) and portable (P1) channels of Annex B. This script draws the waterfalls of rate 2/3
in the 2K mode with fewer bits than the card dvbt_tablea1, which measures the 45
values of the table in the 8K mode.
The first 12 symbols on carriers 0 to 120 of the 2K mode: data (light), scattered pilots, continual pilots and TPS carriers.
link = comnum.Dvbt("2K", "1/4", "16-QAM", "2/3")
packets = comnum.dvb_packets(200, comnum.Rng(1))
cells = link.cells(comnum.Dvbs().outer(packets))  # (K, symbols)
continual = {0, 48, 54, 87}  # Table 7, the first entries
tps = {34, 50}  # Table 8, the first entries
kind = np.zeros((12, 121))
for symbol in range(12):
    for k in range(121):
        if k in continual:
            kind[symbol, k] = 2
        elif k % 12 == 3 * (symbol % 4):
            kind[symbol, k] = 1
        elif k in tps:
            kind[symbol, k] = 3
fig, ax = plt.subplots(figsize=(9, 2.8))
ax.imshow(kind, aspect="auto", origin="lower", interpolation="nearest",
          cmap=ListedColormap([RULE, BLUE, RUST, TEAL]), extent=(-0.5, 120.5, -0.5, 11.5))  # fmt: skip
ax.set(
    xlabel="carrier k",
    ylabel="symbol l",
    title="DVB-T 2K: scattered (blue), continual (rust), TPS (teal)",
)
fig.tight_layout()
The amplitude of the cells confirms the boost: pilots at 4/3, data and TPS at unit mean power.
pilot amplitude 1.3333, mean data power 1.36
The BER after the Viterbi decoder against C/N, rate 2/3, Gaussian and P1 channels.
rng, noise = comnum.Rng(744), np.random.default_rng(744)
table_a1 = {"QPSK": (5.3, 9.6), "16-QAM": (11.4, 15.3), "64-QAM": (16.7, 20.3)}  # Gaussian, P1
fig, ax = plt.subplots()
for (constellation, (gauss, p1)), color in zip(table_a1.items(), [BLUE, RUST, TEAL], strict=True):
    link = comnum.Dvbt("2K", "1/4", constellation, "2/3")
    for channel, required, style in [("Gaussian", gauss, "-"), ("P1", p1, "--")]:
        h = np.ones(link.carriers, dtype=complex)
        if channel == "P1":
            h = comnum.dvbt_channel_gains("P1", link.carrier_frequencies())
        cn = np.arange(required - 1.2, required + 0.41, 0.4)
        ber = []
        for c in cn:
            noise_var = link.carrier_noise_var(c)
            errors = bits = 0
            for _ in range(3):
                tx = comnum.Dvbs().outer(comnum.dvb_packets(150, rng))
                x = link.cells(tx) * h[:, None]
                w = np.sqrt(noise_var / 2) * (
                    noise.normal(size=x.shape) + 1j * noise.normal(size=x.shape)
                )
                rx = link.inner_decode(x + w, 150, noise_var, channel=h)
                errors += int(np.unpackbits(tx ^ rx).sum())
                bits += 8 * len(tx)
            ber.append(errors / bits if errors else np.nan)
        label = f"{constellation}, {channel}"
        ax.semilogy(
            cn, ber, style, marker="o", color=color, markeredgecolor=BACKGROUND, label=label
        )
        ax.plot(required, 2e-4, marker="*", markersize=12, color=color, markeredgecolor=INK)
ax.axhline(2e-4, color=RULE, linewidth=0.8)
ax.set(xlabel="C/N over the K carriers (dB)", ylabel="BER after the Viterbi decoder", ylim=(1e-6, 1e-1),
       title="DVB-T 2K, rate 2/3; Table A.1 (8K) at ★")  # fmt: skip
ax.legend(loc="lower left", fontsize=8)
fig.tight_layout()
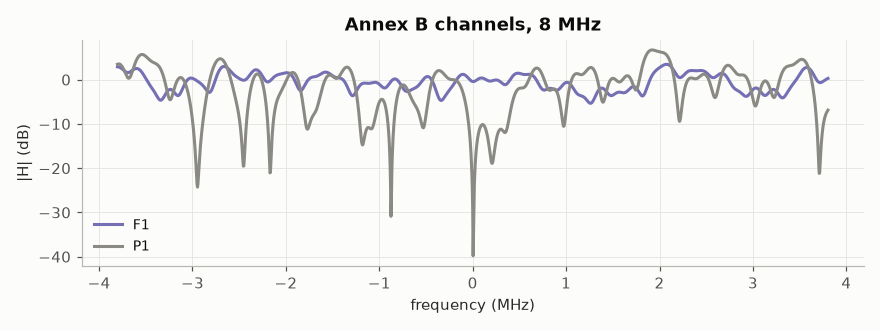
The gain of the portable channel P1 over the band: 20 static echoes of Table B.1 up to 5.4 µs, a deep selectivity that the interleavers spread over the code.
f = link.carrier_frequencies()
fig, ax = plt.subplots(figsize=(8, 3))
for profile, color in [("F1", PURPLE), ("P1", GREY)]:
    g = comnum.dvbt_channel_gains(profile, f)
    ax.plot(f / 1e6, 20 * np.log10(np.abs(g)), color=color, label=profile)
ax.set(xlabel="frequency (MHz)", ylabel="|H| (dB)", title="Annex B channels, 8 MHz")
ax.legend()
fig.tight_layout()
Total running time of the script: (0 minutes 20.285 seconds)