
Note
Go to the end to download the full example code.
M-PSK over AWGN with the Python runner#
The bit error rate of Gray-mapped BPSK, QPSK, 8-PSK and 16-PSK, simulated with the
Monte Carlo runner of comnum.sim: the trial is a Python function, every point
runs until 200 bit errors (or 400 trials), and the result of every point is an error
rate with its Wilson interval. BPSK and QPSK share the same curve
\(Q(\sqrt{2 E_b/N_0})\); beyond four points, every doubling of the order costs
3.5 to 4.5 dB at a BER of \(10^{-5}\), since the points get closer on the circle:
\[P_b \approx \frac{2}{\log_2 M} Q\left(\sqrt{2 \log_2 M \frac{E_b}{N_0}}\sin\frac{\pi}{M}\right).\]
import matplotlib.pyplot as plt
import numpy as np

import comnum
from comnum import sim
from comnum.plot import BACKGROUND, MUTED

ORDERS = [2, 4, 8, 16]


def trial(cond, rng, rec, c):
    k = c.bits_per_symbol
    bits = comnum.bits(k * 8192, rng)
    y = comnum.awgn_ebn0(c.map_bits(bits), cond["ebn0_db"], k, rng)
    rec.errors("ber", int((c.demap_bits(y) != bits).sum()), bits.size)


results = sim.run(
    trial,
    sim.grid(m=ORDERS, ebn0_db=np.arange(0.0, 21.0, 2.0)),
    name="psk",
    seed=7,
    setup=lambda cond: comnum.Constellation("psk", cond["m"]).normalized(),
    stop=sim.Stop.min_errors("ber", 200) | sim.Stop.max_trials(400),
)
fig, ax = plt.subplots()
eb = np.linspace(0, 20, 201)
labels = {2: "BPSK", 4: "QPSK", 8: "8-PSK", 16: "16-PSK"}
for m in ORDERS:
    pts = [r for r in results if r.condition["m"] == m and r.metrics["ber"].value > 0]
    x = np.array([r.condition["ebn0_db"] for r in pts])
    p = np.array([r.metrics["ber"].value for r in pts])
    ci = np.array([r.metrics["ber"].interval(0.95) for r in pts])
    (line,) = ax.semilogy(
        eb,
        comnum.theory_ber(m, eb, "psk"),
        linewidth=1.4,
        linestyle="--" if m == 4 else "-",
    )
    ax.errorbar(
        x,
        p,
        yerr=[p - ci[:, 0], ci[:, 1] - p],
        fmt="o" if m != 4 else "s",
        color=line.get_color(),
        markeredgecolor=BACKGROUND,
        label=labels[m],
    )
ax.plot([], [], color=MUTED, linewidth=1.4, label="theory")
ax.set(
    ylim=(1e-6, 0.5),
    xlim=(0, 20),
    xlabel="$E_b/N_0$ (dB)",
    ylabel="bit error rate",
    title="Gray-mapped PSK over AWGN",
)
ax.legend()
fig.tight_layout()
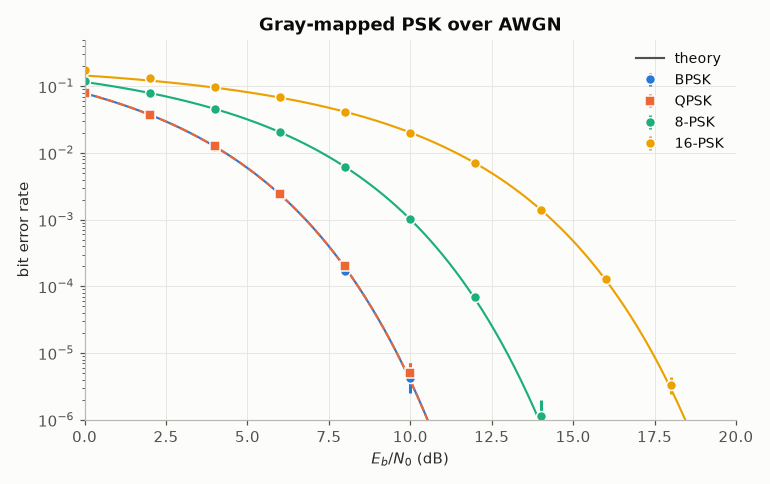
Every point carries its own trial count: the high-SNR points need many more trials to collect their errors.
m= 2 Eb/N0= 0.0 dB  BER=7.877e-02  [7.77e-02, 7.98e-02]  trials=32
m= 2 Eb/N0= 2.0 dB  BER=3.741e-02  [3.67e-02, 3.81e-02]  trials=32
m= 2 Eb/N0= 4.0 dB  BER=1.236e-02  [1.19e-02, 1.28e-02]  trials=32
m= 2 Eb/N0= 6.0 dB  BER=2.445e-03  [2.26e-03, 2.64e-03]  trials=32
m= 2 Eb/N0= 8.0 dB  BER=1.694e-04  [1.49e-04, 1.93e-04]  trials=160
m= 2 Eb/N0=10.0 dB  BER=4.272e-06  [2.55e-06, 7.17e-06]  trials=400
Total running time of the script: (0 minutes 3.249 seconds)