
Note
Go to the end to download the full example code.
5G NR PDSCH: TS 38.101-4 test 1-2 against the RAN4 alignment#
The PDSCH of comnum (comnum.NrPdsch, comnum.NrTransportBlock,
comnum.NrHarqProcess) run through test 1-2 of the demodulation requirements of
3GPP TS 38.101-4 (clause 5.2.2.1.1): the fixed reference channel R.PDSCH.1-1.2 (6 PRBs of
a 10 MHz carrier at 15 kHz, QPSK, MCS 4, a transport block of 480 bits), the channel
TDLC300-100 (Table B.2.1.1-4, 100 Hz of Doppler), 2 transmit antennas with a random Type I
precoder per bundle of 2 PRBs at every slot, 2 or 4 receive antennas, HARQ with 4
processes and the redundancy versions 0, 2, 3, 1. The metric is the fraction of the
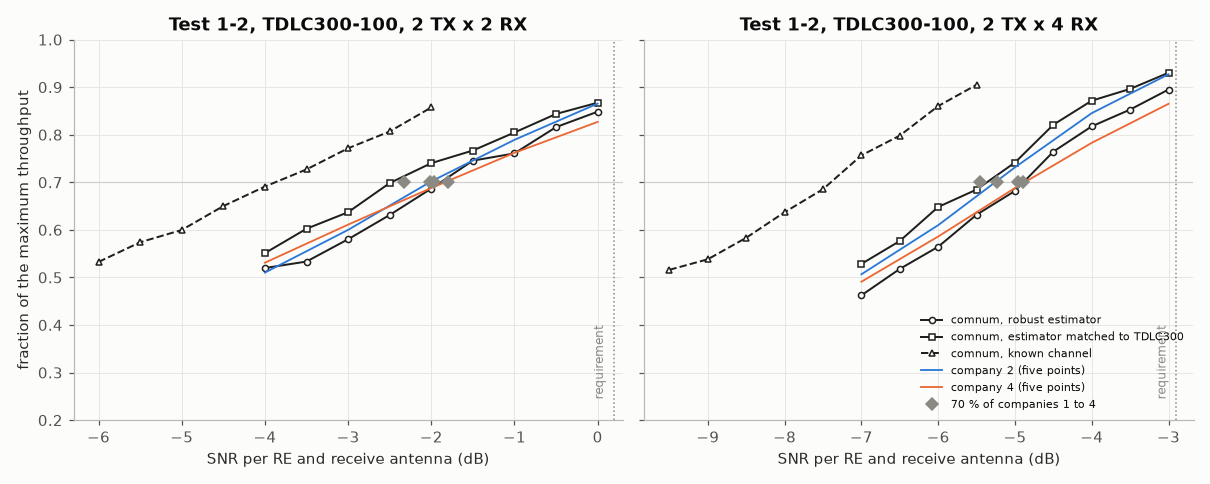
maximum throughput; the requirement is 70 % at 0.2 dB with 2 antennas and −2.9 dB with 4.
Three receivers of comnum. All estimate nothing of the synchronisation (it is perfect), know the noise variance, combine the antennas by maximum ratio and compute exact LLRs; they differ by the channel they use:
robust estimator (circles): the channel with its precoder estimated on the DM-RS of every bundle by a 2-D Wiener filter designed for delays up to the cyclic prefix (4.69 µs) and a Doppler of 100 Hz, the receiver of the card;
matched estimator (squares): the same filter designed for the 2.6 µs of TDLC300;
known channel (triangles): the bound that no estimated receiver can pass.
The industry. When RAN4 set these requirements, each company simulated the tests with its own simulator under common assumptions (R4-1811723) and published its results (the alignment of RAN4 #88bis, Chengdu, October 2018: R4-1812164, R4-1812461, R4-1813439, R4-1813632). They are simulations, not measurements of handsets, and are anonymised here as companies 1 to 4, numbered by their SNR of 70 % with 2 antennas: their 70 % points (diamonds) and the curves of two of them (thin lines, five points each). The requirement adds an implementation margin of about 2 dB to these results.
Reading the figure. The four companies lie between the robust and the matched
estimators of comnum: their spread (0.5 to 0.6 dB) is that of the designs of their
channel estimators; the known channel is 1.5 to 2.5 dB further left. The curves of comnum
are those recorded by the campaign of the card ts38101_4_pdsch
(validation/results/ts38101_4_pdsch.json, 3800 PDSCH slots per point), which checks
every value drawn here.
import json

import matplotlib.pyplot as plt
import numpy as np
import yaml
from _gallery_utils import ROOT

from comnum.plot import BLUE, GREY, INK, ORANGE, RULE

results = json.loads((ROOT / "validation/results/ts38101_4_pdsch.json").read_text())
card = yaml.safe_load((ROOT / "validation/cards/ts38101_4_pdsch.yaml").read_text())


def company(antennas, quantity, **extra):
    """The expected values of the card for the companies: {company: value or [(snr, v)]}."""
    out = {}
    for case in card["cases"]:
        i = case["inputs"]
        ref = str(i.get("reference", ""))
        if (
            i.get("antennas") != antennas
            or i["quantity"] != quantity
            or not ref.startswith("company")
        ):
            continue
        if quantity == "throughput":
            out.setdefault(ref, []).append((i["snr_db"], case["expected"]))
        else:
            out[ref] = case["expected"]
    return out


fig, axes = plt.subplots(1, 2, figsize=(11, 4.4), sharey=True)
requirement = {"2x2": 0.2, "2x4": -2.9}
for ax, antennas in zip(axes, ["2x2", "2x4"], strict=True):
    curves = results["curves"][antennas]
    ax.axhline(0.7, color=RULE, lw=0.8)
    for name, style, label in [
        ("robust", "o-", "comnum, robust estimator"),
        ("matched", "s-", "comnum, estimator matched to TDLC300"),
        ("genie", "^--", "comnum, known channel"),
    ]:
        c = curves[name]
        ax.plot(
            c["snr_db"], c["throughput"], style, color=INK, ms=4, lw=1.3, mfc="white", label=label
        )
    for (ref, pts), colour in zip(
        sorted(company(antennas, "throughput").items()), [BLUE, ORANGE], strict=True
    ):
        pts = sorted(pts)
        ax.plot(*np.array(pts).T, "-", color=colour, lw=1.2, label=f"{ref} (five points)")
    snr70 = company(antennas, "snr_70_db")
    ax.plot(
        list(snr70.values()),
        [0.7] * len(snr70),
        "D",
        color=GREY,
        ms=6,
        label="70 % of companies 1 to 4",
    )
    ax.axvline(requirement[antennas], color=GREY, lw=1, ls=":")
    ax.text(
        requirement[antennas] - 0.1,
        0.25,
        "requirement",
        rotation=90,
        ha="right",
        color=GREY,
        fontsize=8,
    )
    ax.set(
        xlabel="SNR per RE and receive antenna (dB)",
        title=f"Test 1-2, TDLC300-100, 2 TX x {antennas[-1]} RX",
        ylim=(0.2, 1.0),
    )
axes[0].set_ylabel("fraction of the maximum throughput")
axes[1].legend(loc="lower right", fontsize=7)
fig.tight_layout()
plt.show()
The SNR of 70 % of the maximum throughput (dB), from the recorded campaign and the card.
for antennas in ["2x2", "2x4"]:
    c = results["curves"][antennas]
    companies = company(antennas, "snr_70_db")
    print(
        f"{antennas}: known channel {c['genie']['snr_70_db']:.2f}, matched {c['matched']['snr_70_db']:.2f}, "
        f"robust {c['robust']['snr_70_db']:.2f}; companies {min(companies.values()):.2f} to "
        f"{max(companies.values()):.2f}; requirement {requirement[antennas]}"
    )
2x2: known channel -3.88, matched -2.48, robust -1.89; companies -2.33 to -1.80; requirement 0.2
2x4: known channel -7.40, matched -5.37, robust -4.89; companies -5.45 to -4.90; requirement -2.9
Total running time of the script: (0 minutes 0.167 seconds)